Factories don’t lack for standards. Interlocks, alarms, and dashboards exist in every fab, packaging line, and oil & gas facility. Yet some problems remain invisible.
A zone where people get too close to moving equipment during changeover. Extra labor pulled in when a batch of raw material arrives poorly packaged. A tool that creates more dwell than expected, slowing work downstream.
These aren’t violations of protocol. They’re patterns. And patterns are what quietly eat into throughput and safety margins.
Frizb’s platform approaches this from a different angle: turn the cameras you already have into signals you can measure. Then compare those signals against a baseline that reflects what’s actually expected, hour by hour, zone by zone.
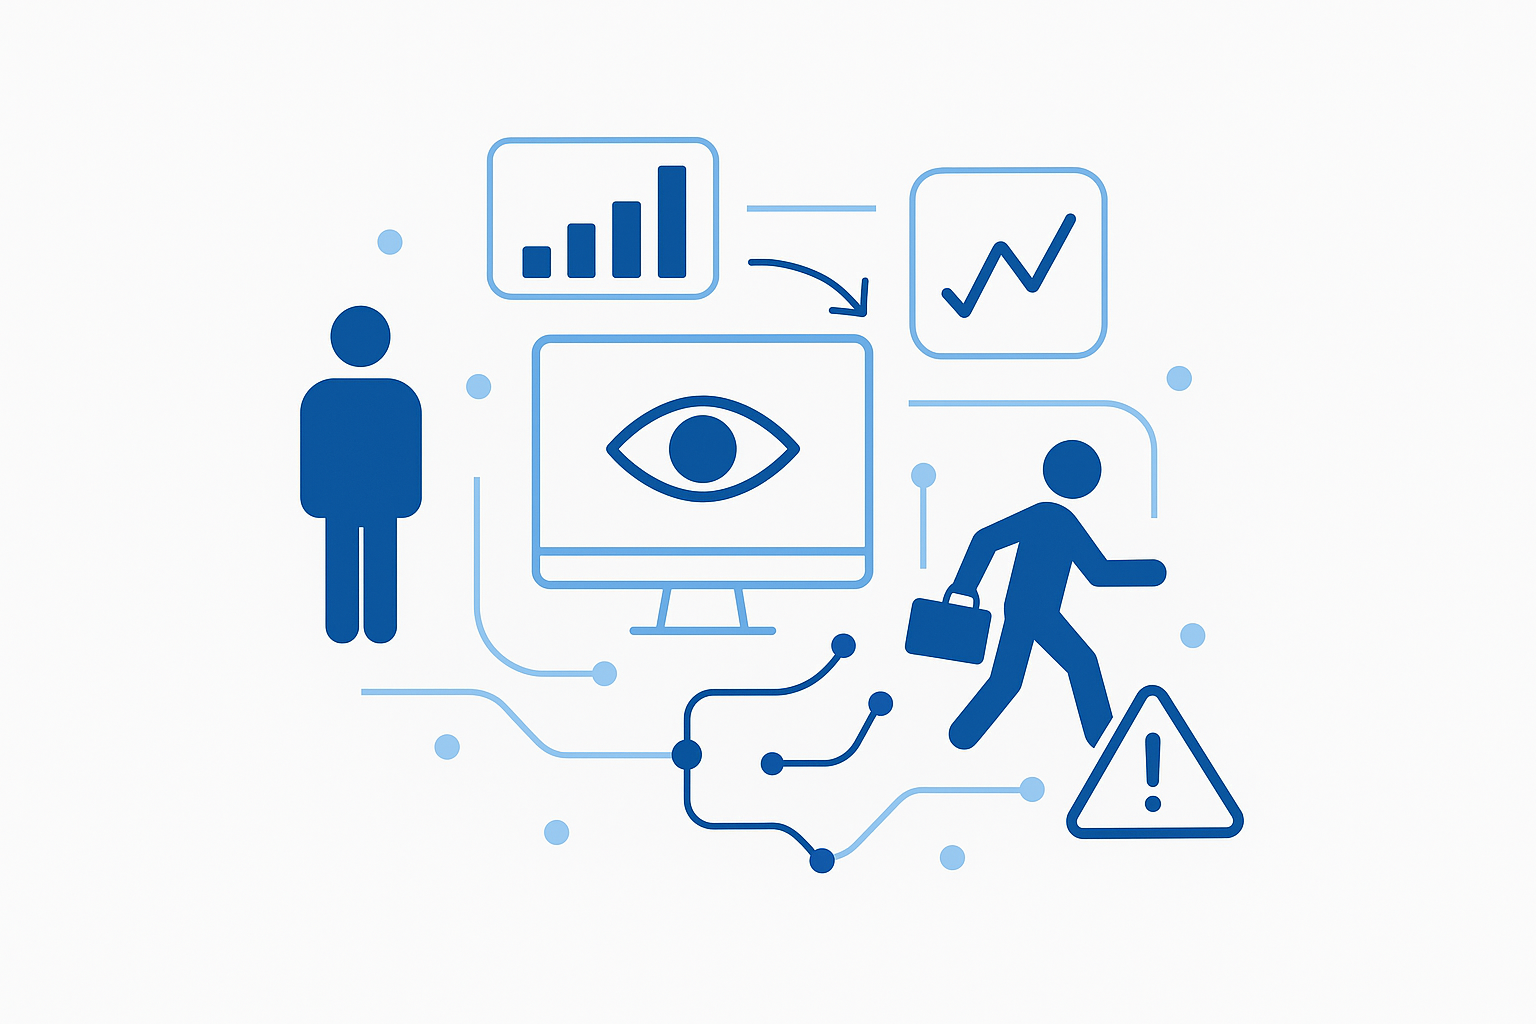
Think of Frizb's Distribution Module as a map of flow, like a Google map showing traffic. It tracks presence, movement, dwell, adjacency, and even environment cues like smoke or flame. It lays them out across hours and zones, highlighting the current operating pattern of the selected day.

The first time you open it, no rules are set. You see reality. Peaks at shift start, dips at break, spikes where you didn’t expect them. This is where learning begins. Compare couple of days in the same week, same day of week across couple of weeks, or even compare them across different sites. This will give you a variations. Some you expect some you don't. Setup a baseline or pick an ideal day and let the system create the auto-baseline for you. You can adjust as you progress. This will get you started quick.

Doesn't matter if you are an executive, supervisor or analyst, this is where you can start seeing your "Plan vs Actuals" in reality. You can set some thresholds to avoid too much noise, the temporary situations should not raise flags. As supervisor marks what “normal” looks like in terms of presence, speed, adjacency hour by hour. Or lets the system suggest ranges from history, then confirms. This keeps noise out and focuses attention on what truly drifts.

Now the module scores each zone hour. Deviations get badges. Trends show when the same issue recurs day after day or hour after hour. Watchlists bring the worst timeframes into the morning standup discussions.
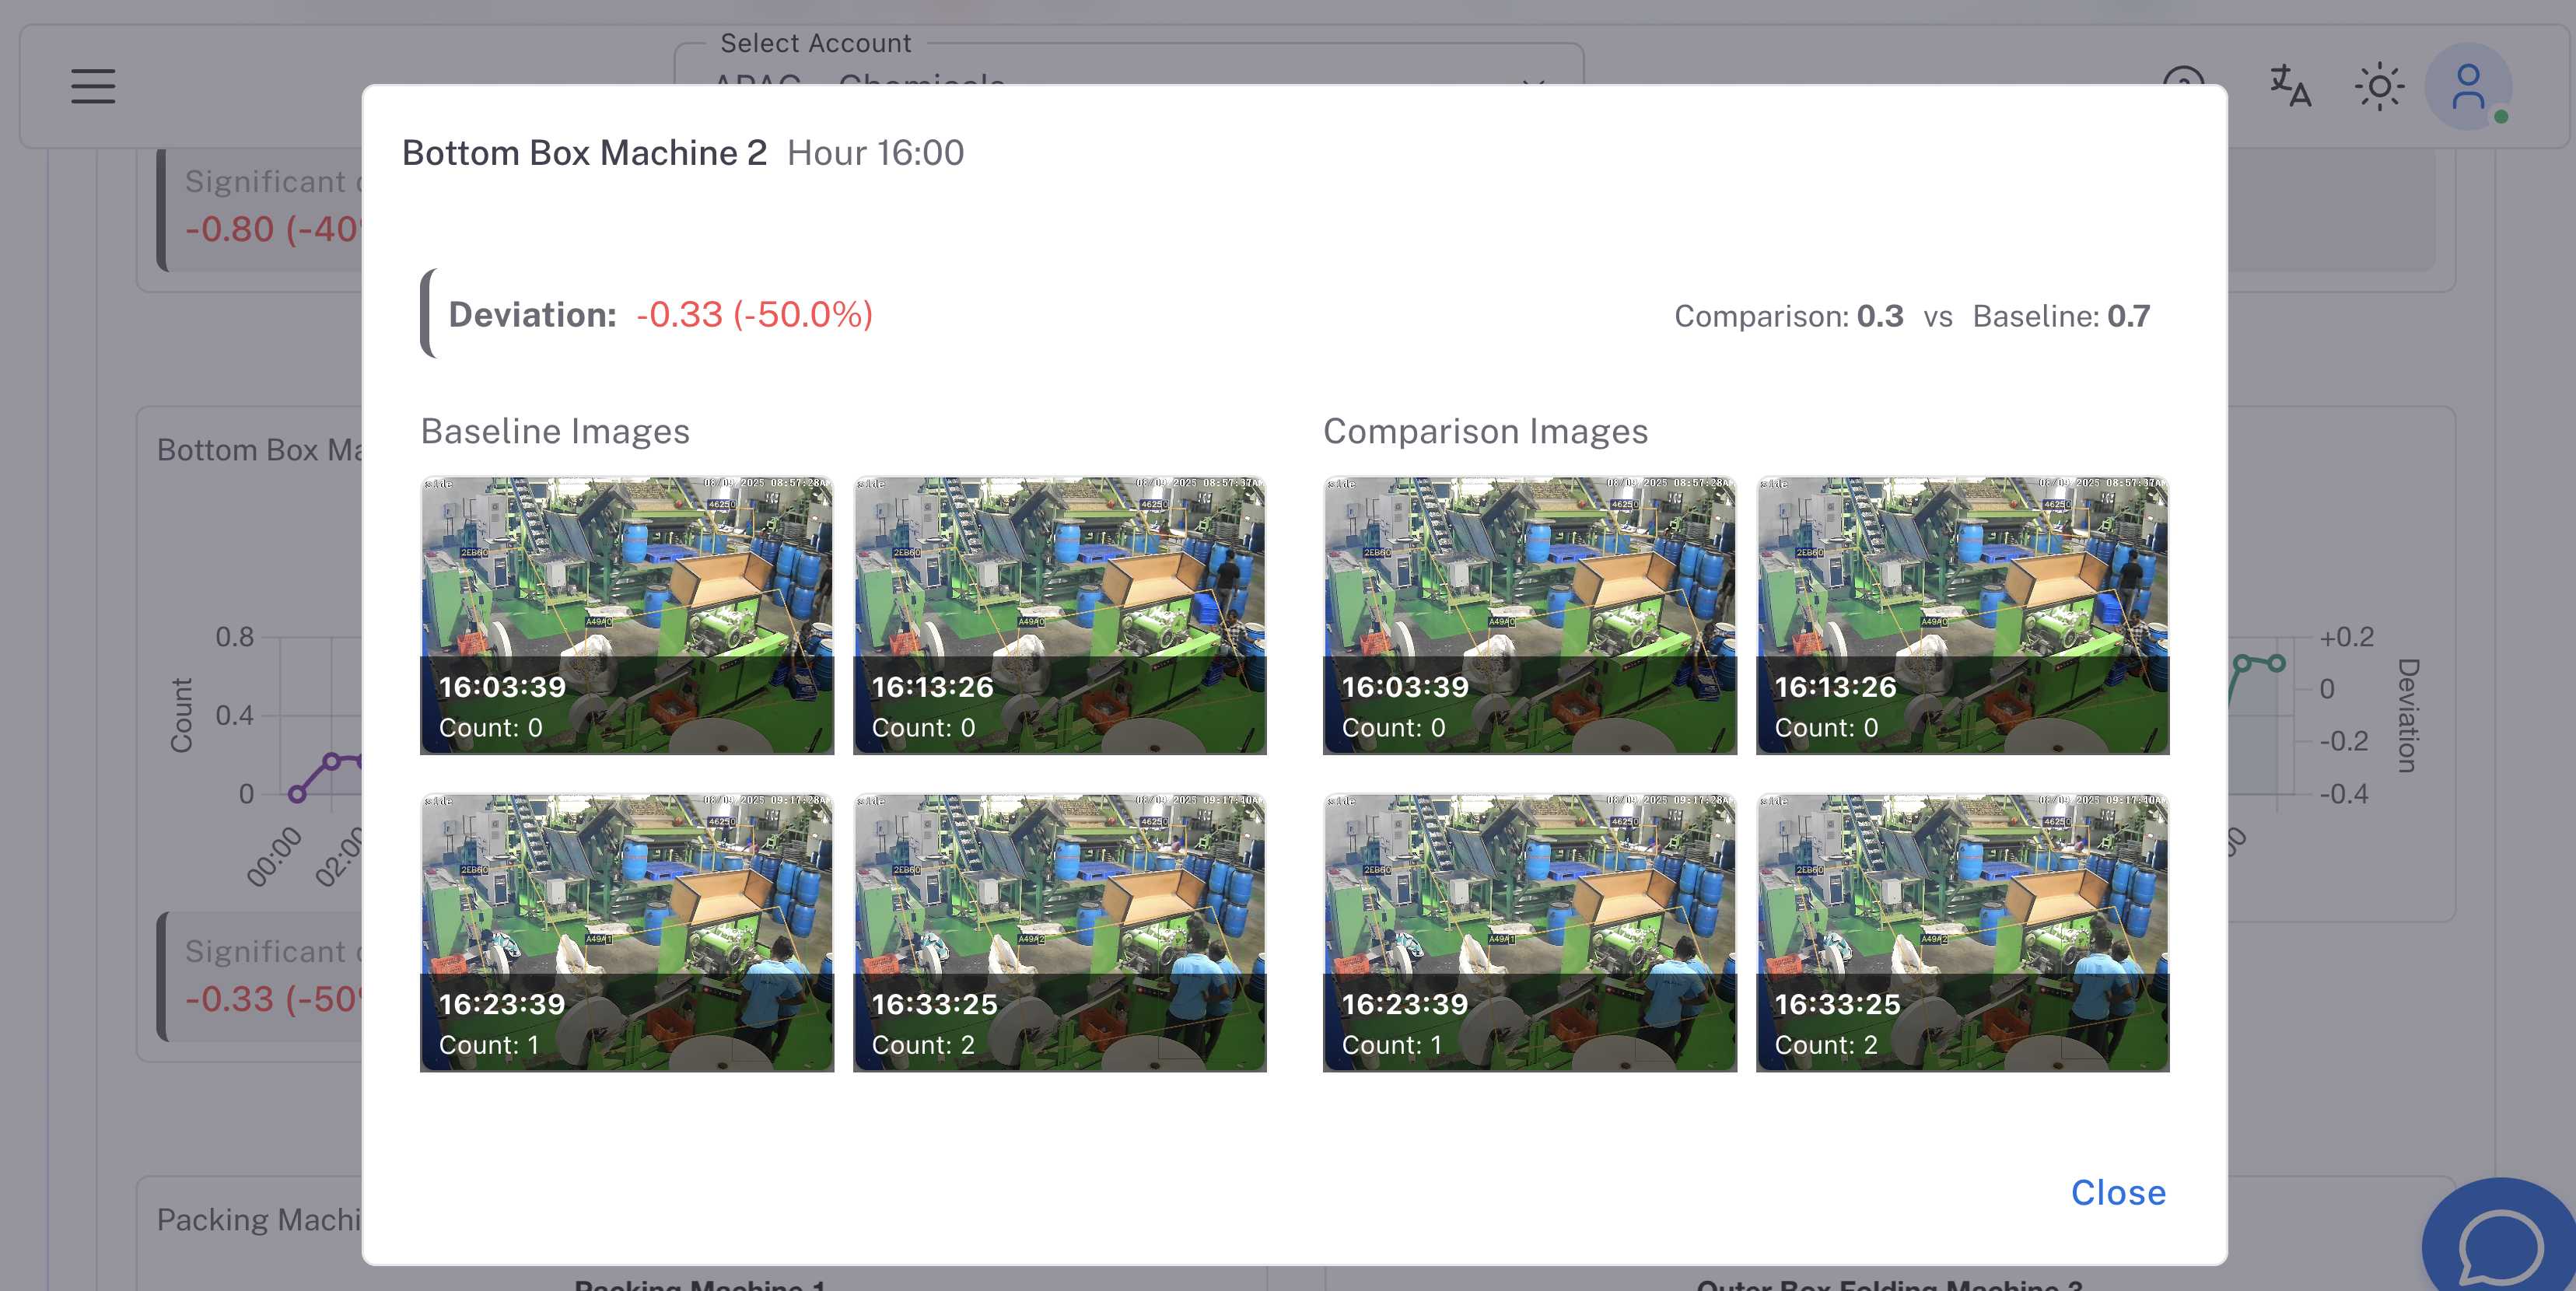
It's time to look closely at some of the worst offenders. Baseline is marked in dotted line. Deviation is in solid line. Filled dots indicate the deviations above the set thresholds.

Every deviation links to short, privacy-aware video or images. Faces blurred, paths highlighted, distances marked. Enough to talk cause and effect without turning into surveillance.
Across industries, shop floors, packaging, oil and gas, some themes like these keep appearing:
The path is short:
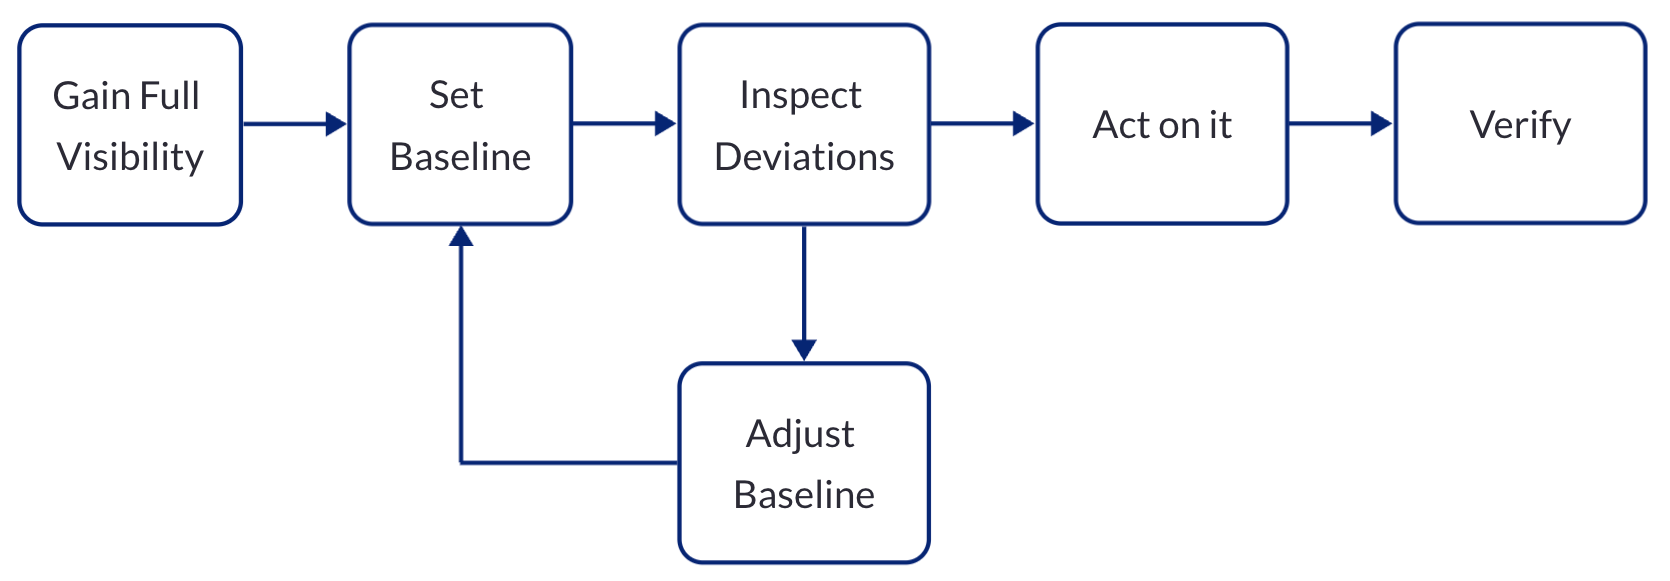
With Frizb’s efficiency and safety features, that loop becomes a few minutes routine in a daily review. Not an extra burden, just a sharper lens on what matters most.
The approach is designed to be privacy-aware: on-prem or private deployment, short retention, role-based access, and clear communication with the workforce. The goal isn’t monitoring people. It’s observing operations so the system itself gets safer, faster, and smarter.
In the end, operations observability isn’t about technology. It’s about seeing what was always there, but hidden in plain sight.