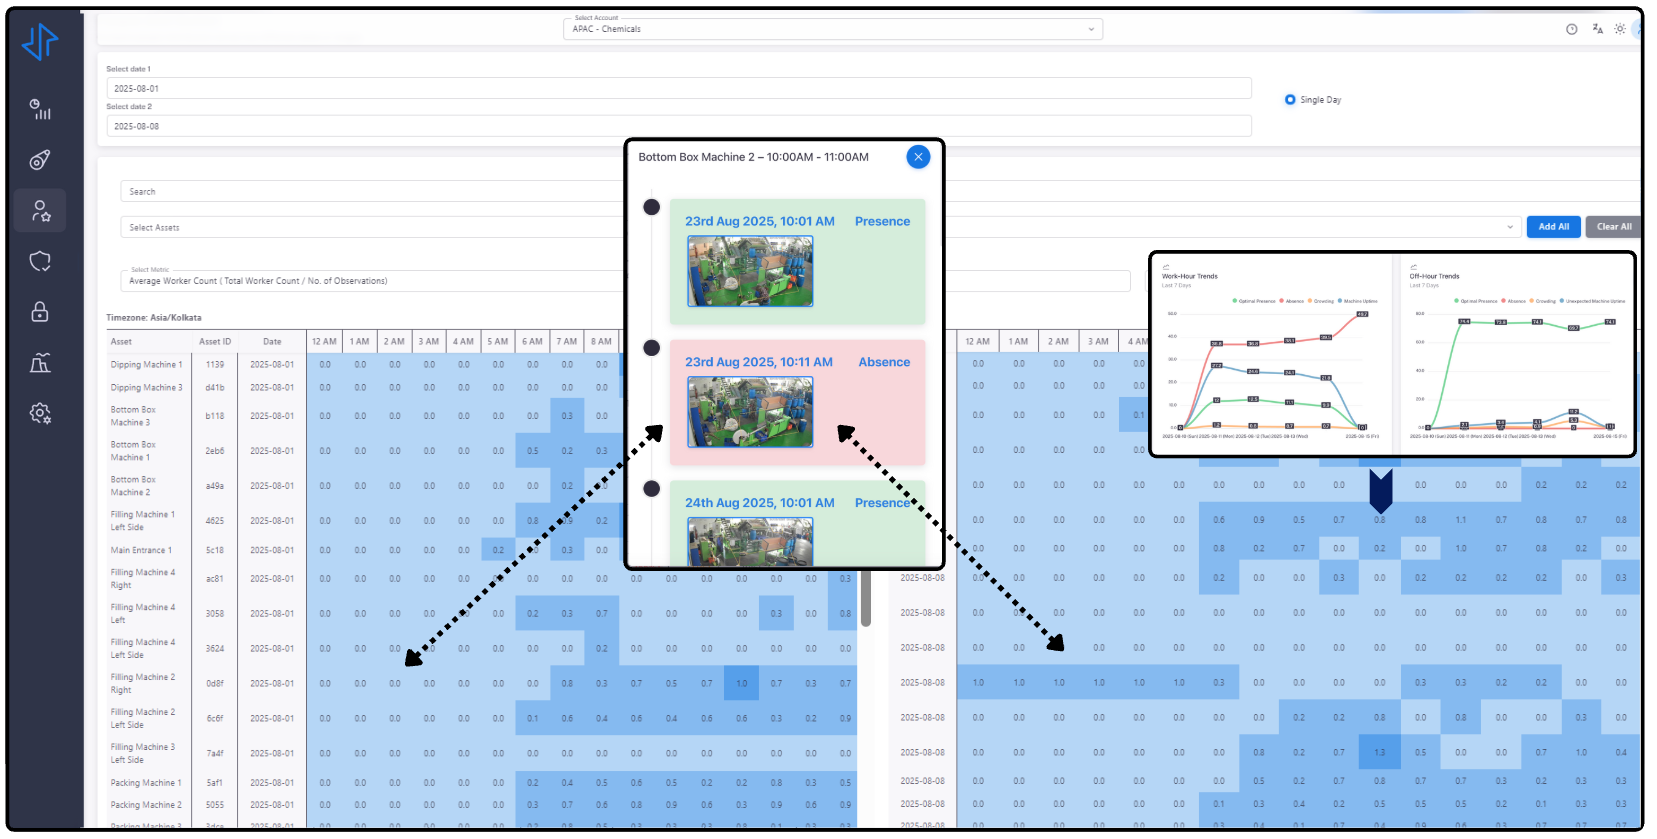
AI Supervisor

Decision Intelligence for Physical Operations

Physical AI Platform Unifying Vision, IT & OT to Improve Safety and Efficiency
Frizb AI Supervisor
Frizb AI Supervisor
Frizb AI Supervisor
Frizb AI Supervisor
Arrow
Arrow

Turning Vision, Sensors, IT & OT Signals into Decisions

Provide visual verification for events, alarms and work orders so teams know exactly what happened and why.
Detect equipment drift and early failure signals to enable predictive maintenance and reduce avoidable field visits.
Improve robotic and AMR safety by slowing, pausing, or stopping systems when people enter unsafe proximity.
Coordinate multi-modal data from cameras, IT logs, and OT messages to trigger precise, timely actions.
Reconcile planned versus actual operations to reveal bottlenecks, misroutes, and unapproved activities.
Automate compliance auditing by capturing evidence for PPE, procedures, machine states, and zone usage.
Technology

Building Blocks for Any Operation

Simple modular blocks that sense activity, understand patterns, predict issues, and take action in any environment. Mix and match what you need. Deploy anywhere.

Sensing Blocks

See what is happening across cameras, IT systems, and OT controls with one continuous view.

Understanding Blocks

Spot patterns, drift, congestion, and early signs of risk across people, machines, and materials.

Prediction Blocks

Catch issues before they grow by detecting deviations, equipment problems, and timing failures.

Action Blocks

Send alerts, slow or stop machines, guide robots, or run workflows based on live conditions.

APIs & SDKs

Developer-ready APIs and SDKs that expose vision events, machine signals, and automation triggers.

Deployment Flexibility

Run on your servers, your cloud tenancy, or as SaaS with full data control.
Dashboard mockup
Product

The Operational Intelligence Platform

image of manufacturing process (for a space tech)
Unifies data from cameras, sensors, and OT systems into a single activity layer
Extracts movement, presence, dwell, and interaction signals automatically.
Identifies changes in environment, resource distribution, or process flow.
Provides time-aligned context for every event across the operation.
ai-powered logistics system
Clusters similar behaviors to reveal recurring operational conditions.
Flags deviations from normal activity without predefined rules.
Measures consistency across shifts, stations, and teams.
Surfaces correlations linking people, machines, and material movement.
[background image] image of assembly line automation tools (for a ai robotics and automation)
Builds automatic baselines for every zone, asset, and workflow.
Detects emerging anomalies, bottlenecks, and risks in real time.
Compares plan versus actual to expose early warning signals.
Learns from past behavior to improve future decisions with reinforcement learning.
image of mission control room
Routes the right signal to the right team based on site context.
Orchestrates multi-step workflows triggered by live conditions.
Captures evidence automatically to support audits and compliance.
Supports a wide range of OT and IT APIs and protocols for seamless integration.
Use Cases By Industry

How Different Industries Use AI Supervisor

Unsafe Zones and Human–Robot Proximity

Helps teams notice when people step into restricted areas or move too close to robotic arms, AMRs, AGVs, or automated cells; Watchtower can slow, pause, or stop machines when needed.

Flow Drift and Emerging Bottlenecks

Surfaces early signs of slowing workstations, growing queues, or unusual dwell-time patterns before they impact output.

Unexpected Tool or Asset Movement

Identifies moments when tools, fixtures, or materials are repositioned or handled in ways that differ from normal working patterns.

Production Rhythm and Cycle Deviations

Highlights shifts in pacing, spacing, or cycle times that indicate a drift from expected production rhythm.

Functional Safety and Compliance Support

Provides visual context around moments where behaviors or conditions may drift from IEC 61508 or ISO 13849 expectations.

Confirming PLC or OT Alarms with Real Activity

When a PLC, Profinet or Modbus alert fires unexpectedly, this shows what was happening at that moment so teams can confirm whether action is really needed.

Aisle, Dock and Traffic Congestion

Highlights early crowding among people, forklifts, AMRs, AGVs, or pallets that can slow loading or create avoidable risks.

Dwell-Time Spikes at Key Locations

Detects longer-than-usual loading, unloading, or staging durations so teams can respond quickly.

Irregular Parcel or Pallet Movement

Identifies items taking unusual paths, stopping unexpectedly, or drifting from expected conveyor or AMR routes.

Vehicle and AMR Safety Patterns

Helps notice unsafe proximity, speed changes, or route deviations involving forklifts, AGVs, or AMRs; Watchtower can slow or hold vehicles for safety.

Temporary Obstructions in Active Lanes

Surfaces pallets, carts, or equipment left in aisles or dock areas that can slow operations or create hazards.

Verifying Conveyor or WMS Alerts with Floor Activity

When conveyors, PLCs, or WMS systems trigger unexpected faults, this helps teams see what was happening physically to confirm whether the alert is valid.

Equipment Access Without Approved Work Orders

Identifies when a rack door is opened or when someone touches servers, switches, or storage hardware without a matching work request. Helps operators catch unplanned activity that could cause outages or confusion during audits.

Liquid Cooling CDU and Line Leak Awareness

Notices early signs of condensation, drips, or pooling around cooling distribution units, overhead lines, and rear door heat exchangers so teams can respond before leaks damage equipment or interrupt service.

Unexpected Physical Adjustments to Servers and Cooling Hardware

Identifies moments when network cables are inserted, removed, or repositioned without a matching work request. Also notices changes to liquid cooling hardware such as quick disconnect fittings, valve knobs, hose connections, or rear door heat exchanger latches. Helps teams catch unplanned physical changes that may affect service or thermal stability.

Abandoned Tools, Carts, or Materials in Aisles

Flags carts, tool bags, or cardboard left in hot aisles or cold aisles that could block airflow or increase the risk of contamination and thermal imbalance.

Visual Verification for Alarms and Remote Signals

When BMS, EPMS, ITIM, or environmental monitoring systems raise an alert, this provides the visual context of what was happening in that row or rack at the moment of the event, helping operators decide if the signal is real or noise.

Maintenance and Utility Work Verification Around Critical Infrastructure

Records and summarizes activity near PDUs, UPS rooms, generators, and substation feeds attached to the data center. Helps confirm that switching steps, isolation points, and sequence of operations were followed correctly.

Predictive Maintenance and Equipment Health

Surfaces early indicators of equipment stress by correlating Vision AI with OT messages such as GOOSE, MMS, and DNP3. Helps teams monitor switchgear behavior, breaker operations, and thermal patterns so aging or failing components are identified before they trip, reducing unnecessary truck rolls.

Thermal Drift, Arc, and Corona Anomalies

Highlights unusual temperature buildup, partial discharge activity, or irregular flashes around conductors and insulators, giving operators early awareness of conditions that may lead to equipment damage or safety risks.

Irregular Human or Vehicle Movement in High Risk Zones

Notices when crews, contractors, or vehicles move close to energized gear or take unexpected paths through protected areas. Watchtower can slow or stop nearby automated systems when required.

Disturbance or Tampering Around Critical Assets

Identifies moments where cabinets, breakers, or yard components are opened, touched, or repositioned in ways that differ from expected work patterns.

Visual Verification for SCADA and OT Events

When an IEC 61850 trip, DNP3 alarm, or breaker state change occurs, this provides the actual visual context at that moment so operators can confirm the event before sending a crew.

Support for Safety and Work Practice Compliance

Provides visual context for reviewing PPE usage, clearance zones, isolation steps, grounding practices, and behaviors related to NFPA 70E, NESC, or internal switching procedures.

Occupancy Map

Track how employees and visitors use offices, campuses, and shared spaces in real time to prevent overcrowding, improve flow, and optimize layouts for safety and comfort.

Access Control

Ensure only authorized individuals enter sensitive zones, with alerts for tailgating, door propping, or unusual access patterns to strengthen security and compliance.

Facility Watch

Detect smoke, spills, or blocked exits quickly to prevent accidents, reduce disruption, and maintain compliance across campuses, offices, and public spaces.

Dwell Time

Measure how long people, visitors, or vehicles stay in lobbies, meeting rooms, or parking areas to identify bottlenecks, improve flow, and enhance the occupant experience.

Safety Posture

Detect falls, unallowed items, and unsafe behavior while monitoring camera health, tampering, and vandalism to keep campuses, offices, and public spaces safe and compliant.

Threat Watch

Detect loitering, suspicious behavior, or  reconnaissance activity to prevent organized crime and security breaches in campuses, offices, and public spaces.
Impact By Numbers

Measurable Outcomes

$1.5 M

Annual Savings

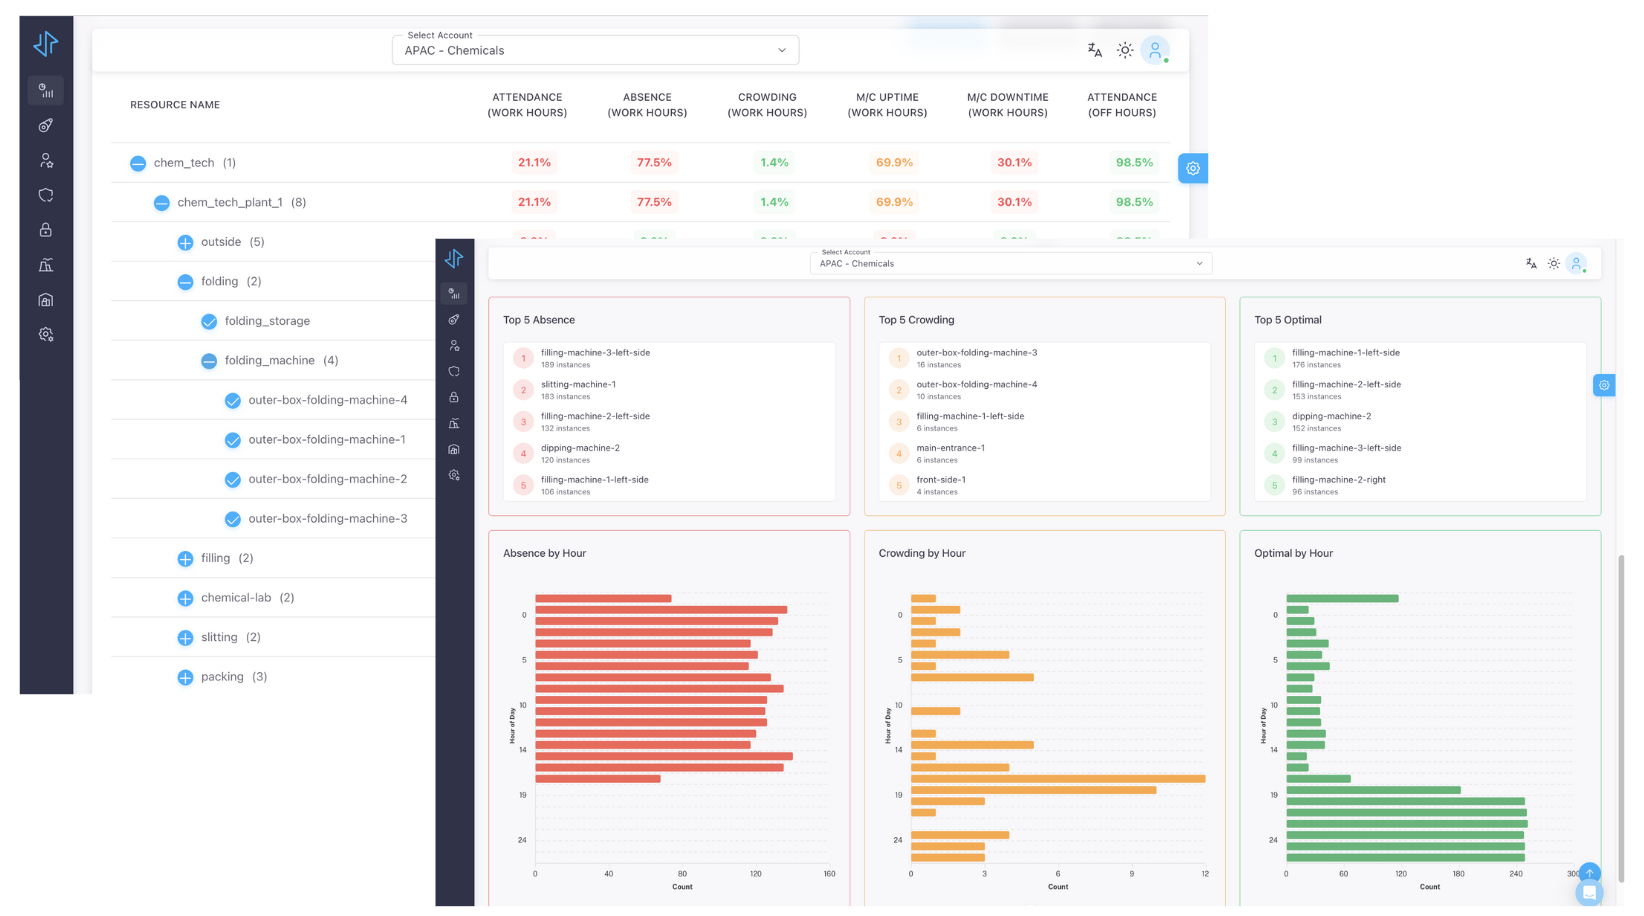
By reducing machine downtime, accidental liability, machine damage and wastage at a CPG industry

20 K

Signals

Monitored across 100+ sites concurrently to track complex SOP deviations in Real-Time

7.9%

OEE improvment

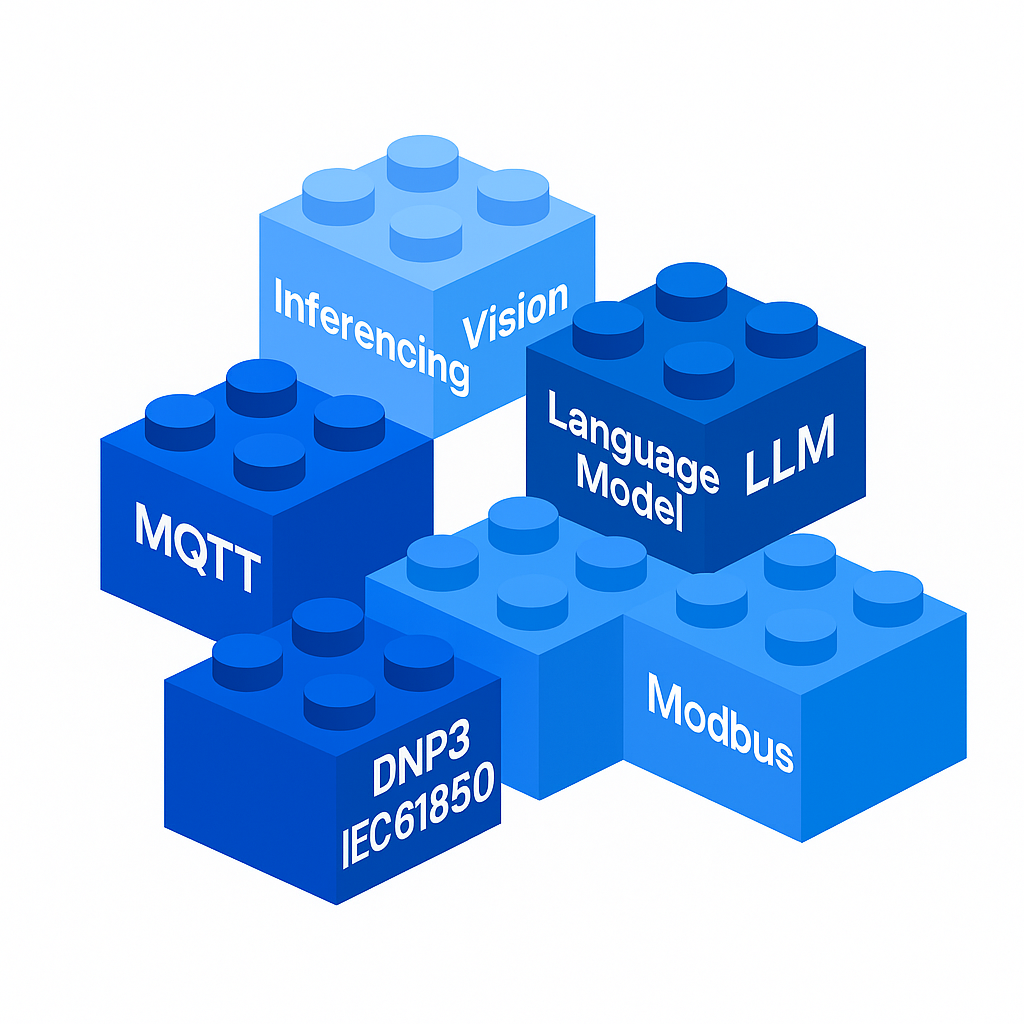
By integrating Vision AI with Machine Control MCP Service to integrate OT Systems (PLC)

Features

Evidence-Driven Strategy

Compare operational activity across days to uncover variations that affect flow, productivity, and resource use. Link these differences to root causes such as inventory bottlenecks and machine downtime to guide smarter decisions.
Reveal shifts in workforce activity that impact throughput
Identify patterns of crowding or absence that slow operations
Connect bottlenecks to inventory delays or machine downtime
Understand drifts from the plan, backed by visual evidence
Move from raw observations to actionable insights
Dashboard mockup
Dashboard mockup
Features

Global Operational View

Get a single view of all your sites worldwide. See performance, safety, and efficiency patterns across regions at a glance, then drill down into any plant, line, or shift to uncover root causes. Compare trends, spot risks, and prioritize actions with evidence you can trust.
Features

Tactical Visual Intelligence

Measure what matters with Untitled’s easy-to-use reports. You can filter, export, and drilldown on the data in a couple clicks.
Convert vision data into trackable business KPIs
Save, schedule, and automate reports to your inbox
Connect the tools you already use with 100+ integrations
Dashboard mockup

Start Your Free Trial

Frizb AI Supervisor
Frizb AI Supervisor
Frizb AI Supervisor
Frizb AI Supervisor

Turn Any Camera
into AI Supervisor

Transform existing camera feeds into operational live blueprint
Reveal inefficiencies, safety risks, and hidden costs in real time
Integrate IT and OT data to uncover true business impact
Clarity to act with confidence, focus on what truly drives impact